- What we looked at: 22.7 million citations, the sources AI engines point to when they answer a question, across ChatGPT, Gemini, Perplexity, Google AI Overviews, and Google AI Mode, from January to June 2026. All five engines cited on 531,889 of the same questions, and every all-five comparison below runs on those.
- ChatGPT is the odd one out. On the same question, Perplexity never touches 89.1% of the websites ChatGPT cites, and running the comparison the other way gives 90.1%. That gap is about which slice of the web ChatGPT draws from, not about it choosing more unpredictably than the others.
- Ask all five the same question and they mostly point at different things. Counted question by question, 79.6% of the sources they cite show up on one engine and nowhere else. Only 0.31% show up on all five.
- Brands co-occur more often than pages do. The engines land on the same exact page 6.8% of the time and name the same company 30.3% of the time. Most of that gap is because an answer names a handful of brands and cites thousands of possible pages, so brand overlap is the easier target rather than the stronger signal.
- What mostly separates the engines is which slice of the web they draw from. Google’s two Search surfaces agree 3.4x more than cross-company pairs, but once you account for how much their candidate pools overlap, that advantage disappears. Differences in how engines choose do remain, and they do not follow who built them.
- Bottom line: keep a headline number if it helps, but it has to open into five engines plus a brand line. Anything less cannot tell you which surface moved.
Updated 30 July 2026: we ran a permutation test against our own two headline findings to see how much of each would survive if the engines were picking at random. Part of both did not. The brand-over-page gap and the gap between Google’s two surfaces are now reported against that baseline, and the sections below say what changed and why.
What survived our own tests, and what didn’t
- Held. The 79.6% headline, which strengthens to 93.2% under the strictest matching and stays inside a 3.3-point band in every one of the six months. The per-engine uniqueness figures. The raw page, website, and brand agreement levels. The direction of the ChatGPT gap, since running the 89.1% the other way returns 90.1%.
- Held, but narrower than we first said. Brand co-occurring 4.5x more than pages is real as a rate, and it is not evidence that brand carries better. Against a random baseline the order reverses and page agreement is the stronger signal.
ChatGPT’s gap against every rival is the same kind of claim. Against that baseline its pairings are not unusual, so the gap describes a different candidate pool rather than a more unpredictable engine.
- Did not survive. The idea that engines sharing an owner agree because they choose alike. Adjusted for candidate pools, the ordering by owner disappears and the 3.4x premium becomes 1.06x.
- Not yet tested. Against a random baseline: the convergence trend, the category figures, and the engine-count measures behind the 79.6% headline and the per-engine uniqueness shares. We ran that test on the pairwise agreement figures, not on those.
Also untested: run-to-run variation within a single engine, and whether per-engine scores move together at all. Read all of those as unaudited.
Picture the dashboard your team checks every Monday. One big, confident number: your AI visibility score. It went up two points this week, so someone adds a green arrow to the slide and everyone moves on.
That number is not wrong. It is incomplete, and this study shows exactly how much it hides. It blends five surfaces that cite almost nothing in common, so until you can open it and see the five underneath, you cannot say which one moved or what to do next.
First, what a citation actually is
When you ask ChatGPT, Gemini, or Perplexity a question, the answer usually comes with sources attached: links to web pages, or the names of companies mentioned in the text. Those are citations. They’re how a brand gets noticed in AI search, much as a blue link on a Google results page does. This study counted 22.7 million of them.
We pulled six months of these citations from Wellows’ own data: 22.7 million citations, 1.15 million questions, and 441,946 different websites, January through June 2026.
All of the questions are in English, and they span 27 markets: 84% of them in the United States, with the rest led by Australia, the United Kingdom, and the Philippines.
Not every engine answers every question. All five cited at least one website on 531,889 of those questions, covering 13.0 million of the citations and 280,245 websites.
Every all-five comparison in this study runs on that set, so no engine is ever judged on a question it sat out. Comparisons between just two engines use every question that pair answered, and we flag the base wherever it changes.
Then we asked a simple thing of it. When five AI engines answer the same question, do they point to the same sources or different ones?
They point to different ones. Overwhelmingly. And the gap is widest exactly where most people assume it’s narrowest.
We compared what each engine cited, question by question, at three levels of detail: the exact web page, the website it sits on, and the brand named in the answer. The full method sits at the end, along with the caveats and the tests we ran against it.
The main finding: the five engines mostly don’t agree
Start with the simplest possible question. Take everything all five engines cited, and count how many engines cited each source. If the five were drawing on the same pool for the same question, most sources would show up on several engines at once.
They don’t.
of the websites cited on a question appear on only one of the five AI engines
Those 531,889 questions produce 8,729,964 website-and-question pairings. Exactly one engine cited 6,949,766 of them, and no other engine touched them. In between, 14.5% reached two engines, 4.4% reached three, and 1.2% reached four. Only 0.31%, 27,097 pairings, made it onto all five. Those figures pool all six months. June alone runs 78.5% and 0.59%.
Source: Wellows internal citation dataset, Jan–Jun 2026Two different measures run through this post, and it is worth separating them now. This 79.6% counts how many of the five engines cited each source.
The agreement percentages further down count how much any two engines’ source lists overlap on the same question. Different measures, same direction.
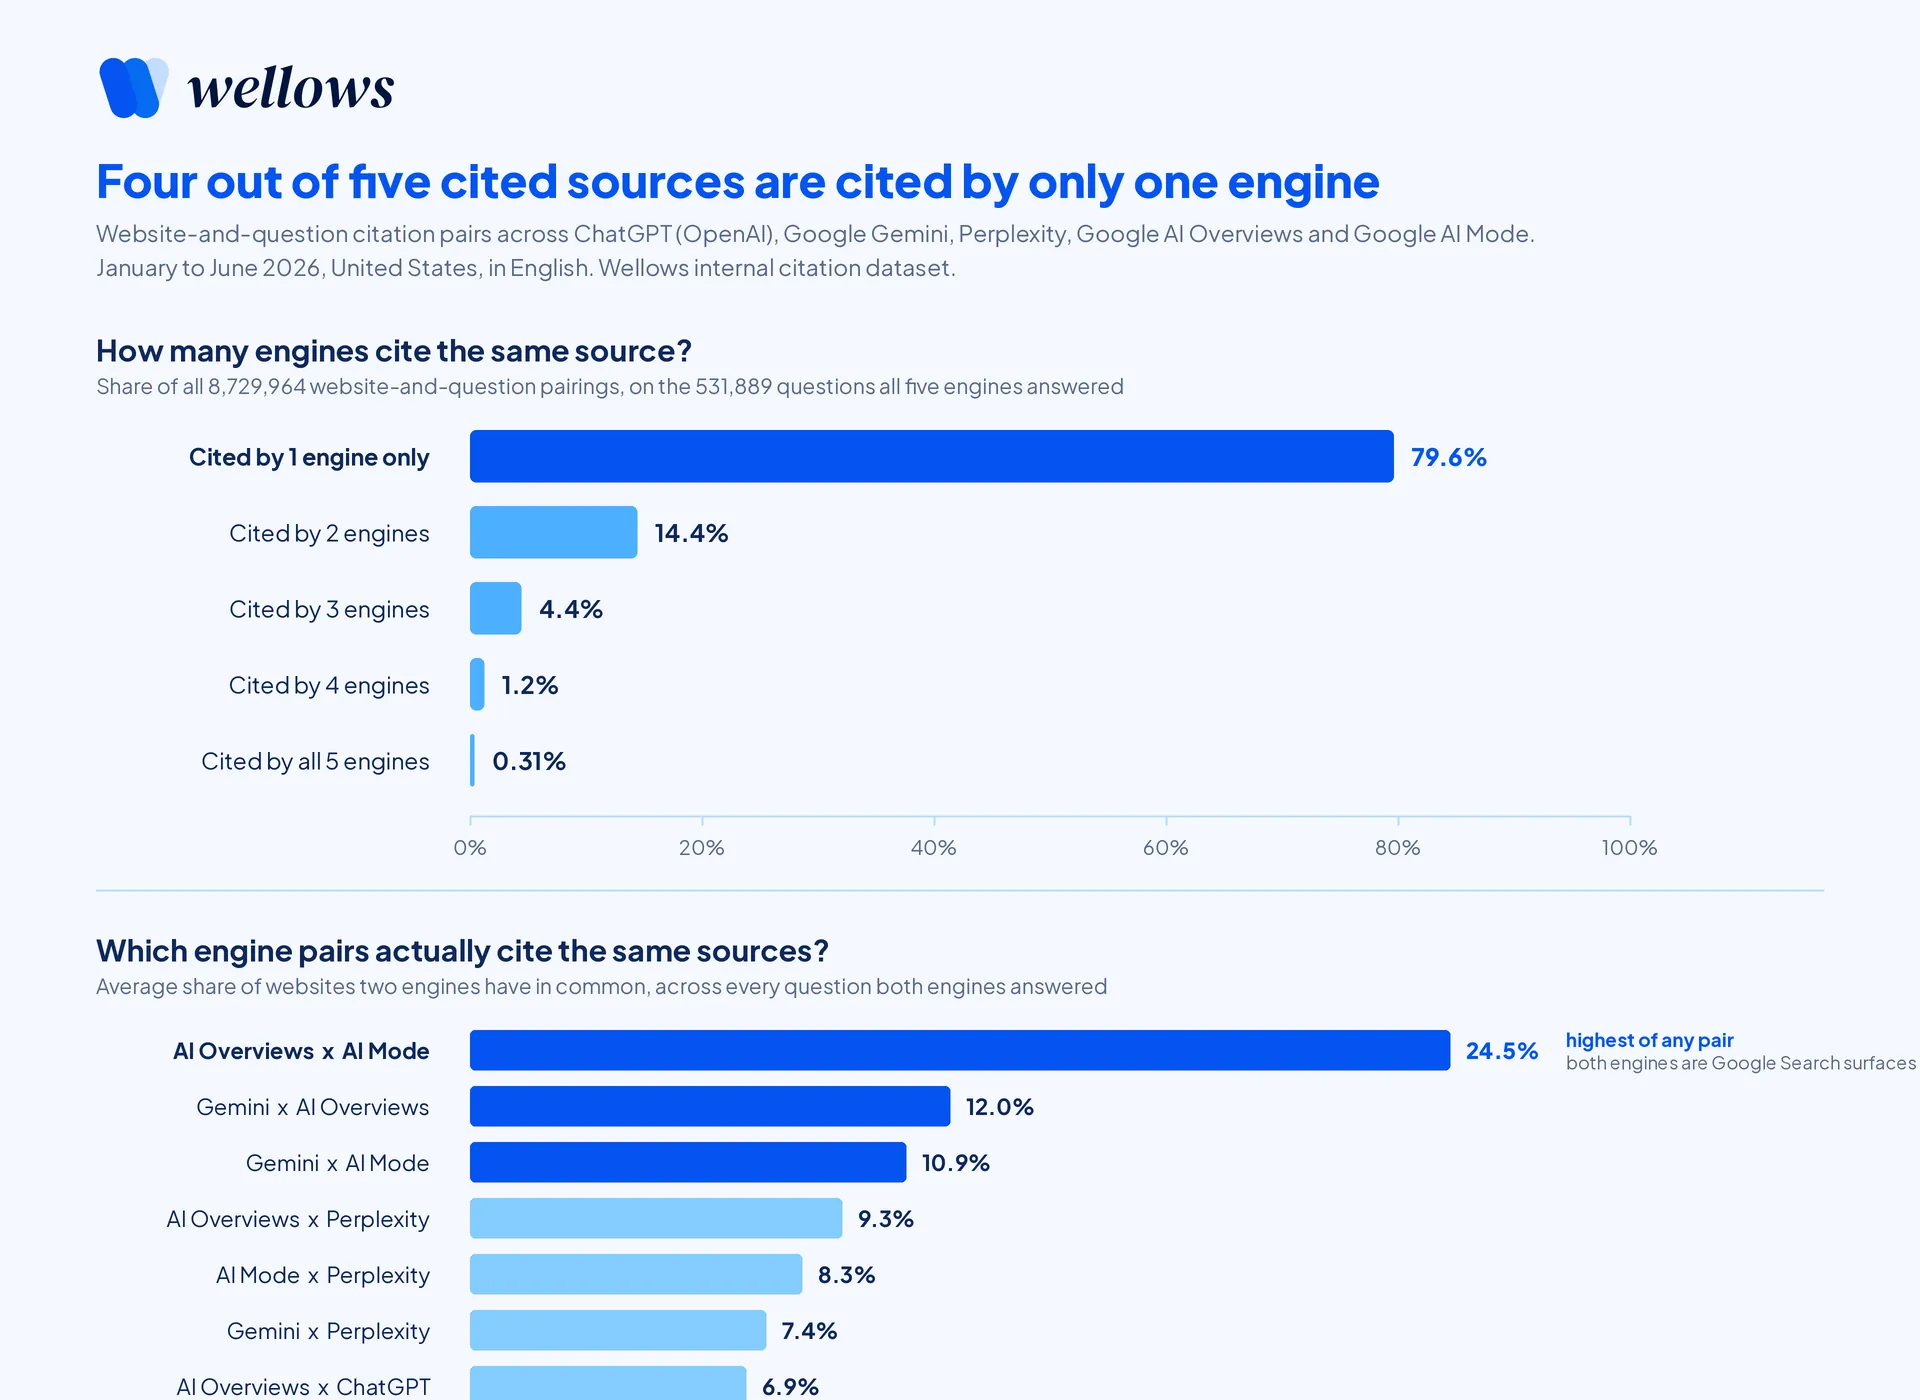
Top: nearly 80% of websites cited on a question show up on a single engine, and full agreement across all five is a rounding error at 0.31%. Bottom: every engine pair ranked by how often they cite the same sources, with AI Overviews and AI Mode leading at 24.5% and every ChatGPT pairing sitting at the bottom.
A number that big invites a fair challenge: maybe it’s a quirk of one odd month. So we checked each month separately.
The share that only one engine cited held between 77.7% and 81.0% in every single month, a spread of just 3.3 points. This isn’t one strange batch of questions. It’s how the system behaves.
Inside that narrow band it does tilt downward, though not smoothly, since it rose in February and again in June. That tilt is the convergence we return to later.
Now look at the lower half of that chart, where the pattern gets specific. Rank all ten possible engine pairings by how often they cite the same sources and the order isn’t random at all:
- AI Overviews and AI Mode agree most, at 24.5%
- Gemini and AI Overviews follow at 12.0%, then Gemini and AI Mode at 10.9%
- Every pairing of two Google engines beats every pairing across different companies
- Every pairing involving ChatGPT lands in the bottom four, ending with ChatGPT and Gemini at just 6.1%
That ordering is what most readers will take away, and we unpack it further down. It looks like a story about who built each engine. Measured against a random baseline it turns out not to be, which is the part most worth reading.
The practical consequence is immediate. When an AI visibility tool hands you a blended score with nothing underneath it, it is averaging five surfaces that barely overlap.
A blended number can still track your direction. What it cannot do on its own is tell you which of the five surfaces moved, or why.
That is a reporting problem, and it has a straightforward fix. Keep the headline number if your team likes it, then put the five engines and a separate brand line underneath so the number always opens into its parts. Everything below is an argument for that structure.
One limit on the argument, since it is the practical claim most people will take away. We measured how much the engines’ source lists overlap on the same question.
We did not test whether your visibility score on one engine predicts your score on another, which is a different question with a different answer. Two engines could each cite you at a similar rate while never once picking the same page.
So read this as a case for opening the blended number up, not as proof that the number carries no information.
ChatGPT is the odd one out
One engine stood apart at every stage of this analysis, so it’s worth taking on its own. Flip the question around: of everything each engine cites, how much does no other engine touch for the same question?
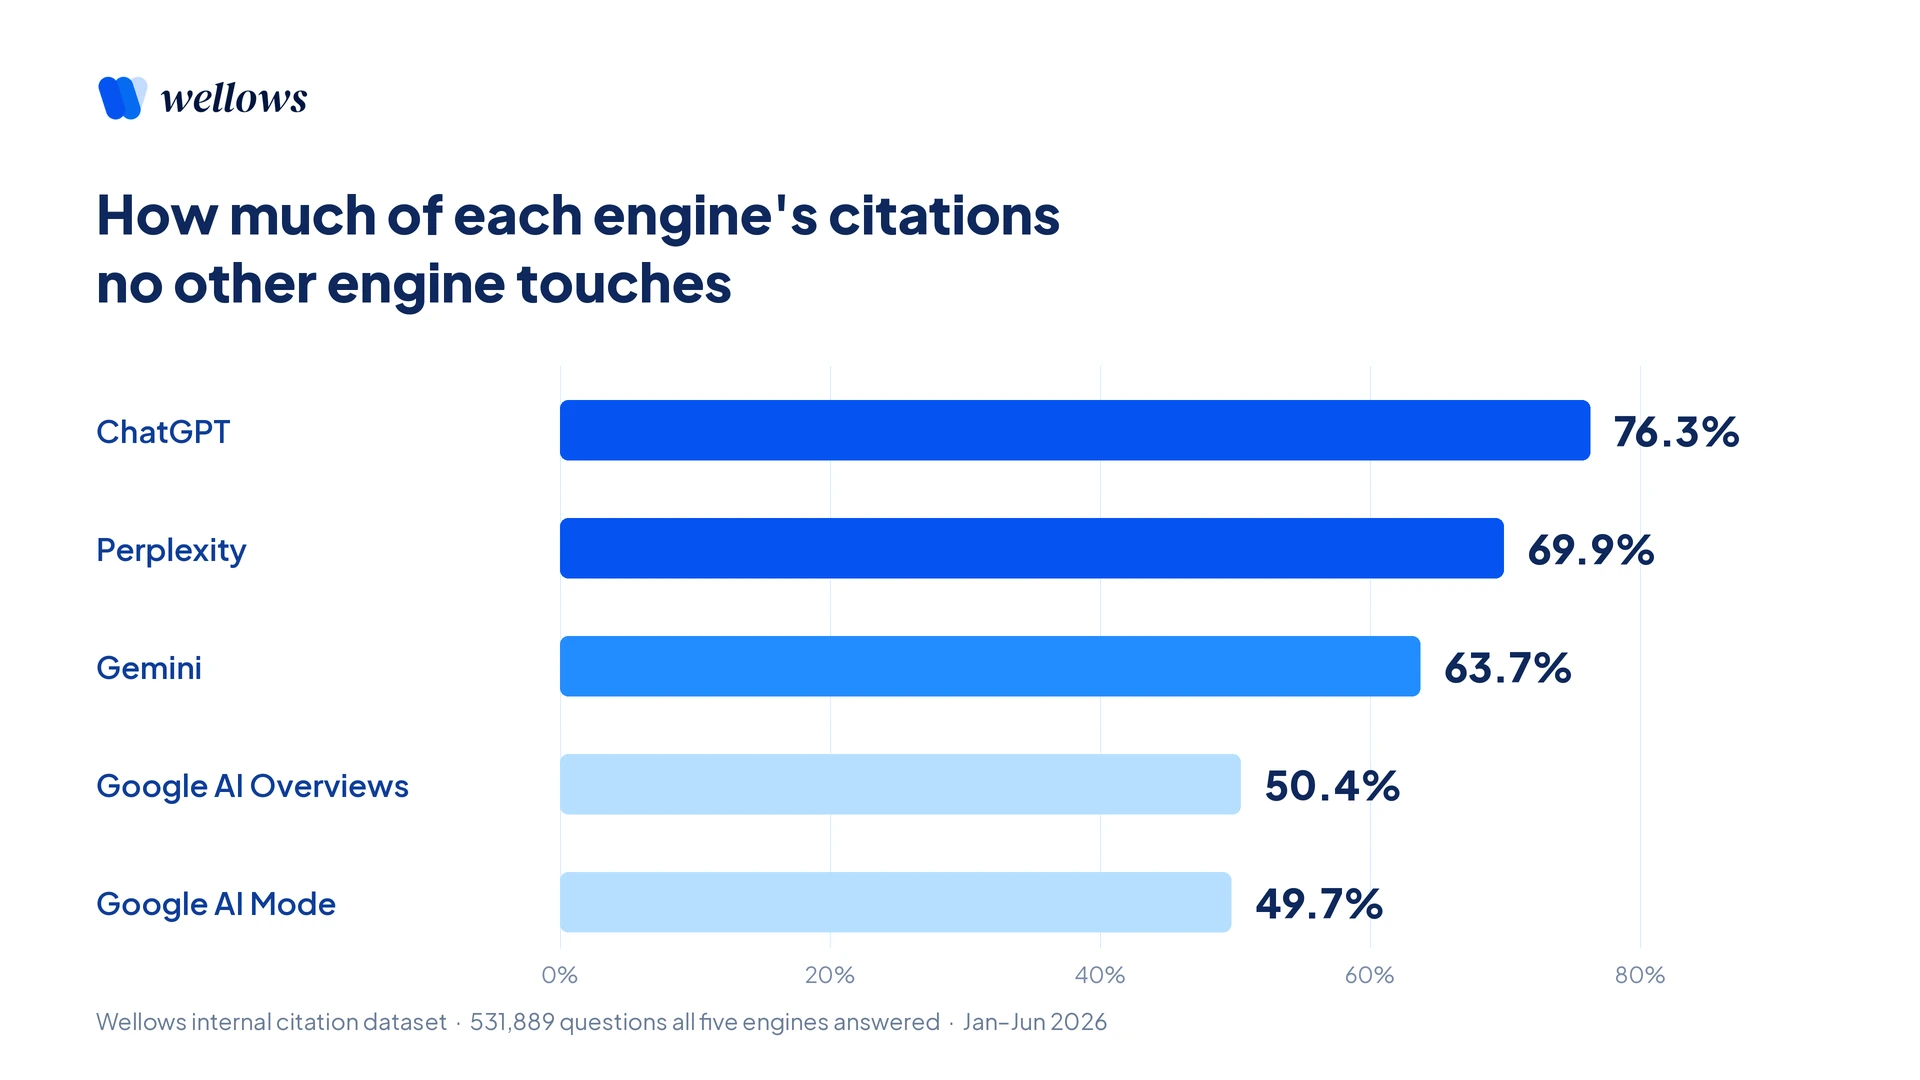
No other engine touches 76.3% of the sources ChatGPT cites, the highest share of any engine. Google’s two surfaces are the least unique, at around 50%.
ChatGPT leads at 76.3%. More than three-quarters of what it cites, none of the other four engines used for the same question.
Perplexity follows at 69.9%, Gemini at 63.7%, and Google’s two surfaces sit near 50% (AI Overviews 50.4%, AI Mode 49.7%), which is what you would expect from two surfaces that overlap heavily with each other.
Compare ChatGPT against one rival at a time and it gets starker. Of every website ChatGPT cites:
- Perplexity never touches 89.1% of them on the same question
- Google AI Overviews never touches 89.2%
- Google AI Mode never touches 90.2%
- Gemini never touches 91.5%
No rival engine recovers even one in eight of ChatGPT’s sources.
Those four figures run one direction, so we measured the other one too. Of every website Perplexity cites, ChatGPT never touches 90.1% on the same question. The reverse comes out at 89.7% against AI Overviews, 89.6% against AI Mode, and 90.5% against Gemini.
So the gap is not an artefact of which engine you divide by. The two directions sit within 1.4 points of each other in every pair, and three of the four reverses come out slightly larger than the published figure.
Which direction is larger simply tracks how many sources each engine returns per answer: 4.7 websites for Perplexity, 4.5 for AI Overviews, 4.2 for ChatGPT, 4.0 for AI Mode, and 3.8 for Gemini.
One thing the numbers still do not mean. They count each question separately, so a website Perplexity missed on one question may well be a site it cites often on others. What the two engines disagree about is which source answers this question, not which websites exist.
If you want to see that split on your own website, our Perplexity visibility check shows which of your pages Perplexity cites, so you can set the result against your ChatGPT one.
The takeaway is blunt. Getting cited by ChatGPT is its own separate job. Its source lists have the least in common with the other four, at least as far as this data can see.
We did not test whether doing well on AI Overviews predicts doing well on ChatGPT, so read this as a reason to measure ChatGPT on its own line rather than a finding that page work never carries across.
One qualification, which only became visible once we ran the random baseline described further down. ChatGPT’s raw gap is the widest of the five, but it is not evidence that ChatGPT chooses more unpredictably than the others.
Measured against what each pair would score picking at random, ChatGPT’s four pairings run from 11.2x to 19.1x above chance, which spans most of the 10.5x to 19.7x range covering all ten pairs.
The clearest case is the pairing that looks worst in raw terms: Gemini and ChatGPT agree on just 6.1% of websites, the lowest of the ten, yet against chance that pair sits third highest. ChatGPT with Perplexity, also near the bottom in raw terms, comes second.
So what sets ChatGPT apart is the slice of the web it draws from, not how it picks within it. The practical conclusion does not change, and if anything it firms up: you cannot infer ChatGPT’s citations from the other four, so it needs its own line.
The good news: brands co-occur, pages don’t
So far this is a gloomy picture. This next finding is the one that turns it into a plan, though it needs more care than we first gave it.
Agreement isn’t a single number. It depends on how specific you’re being. We measured all three levels the same way, on one identical set of questions, and a gap opened up that reframes the whole problem.
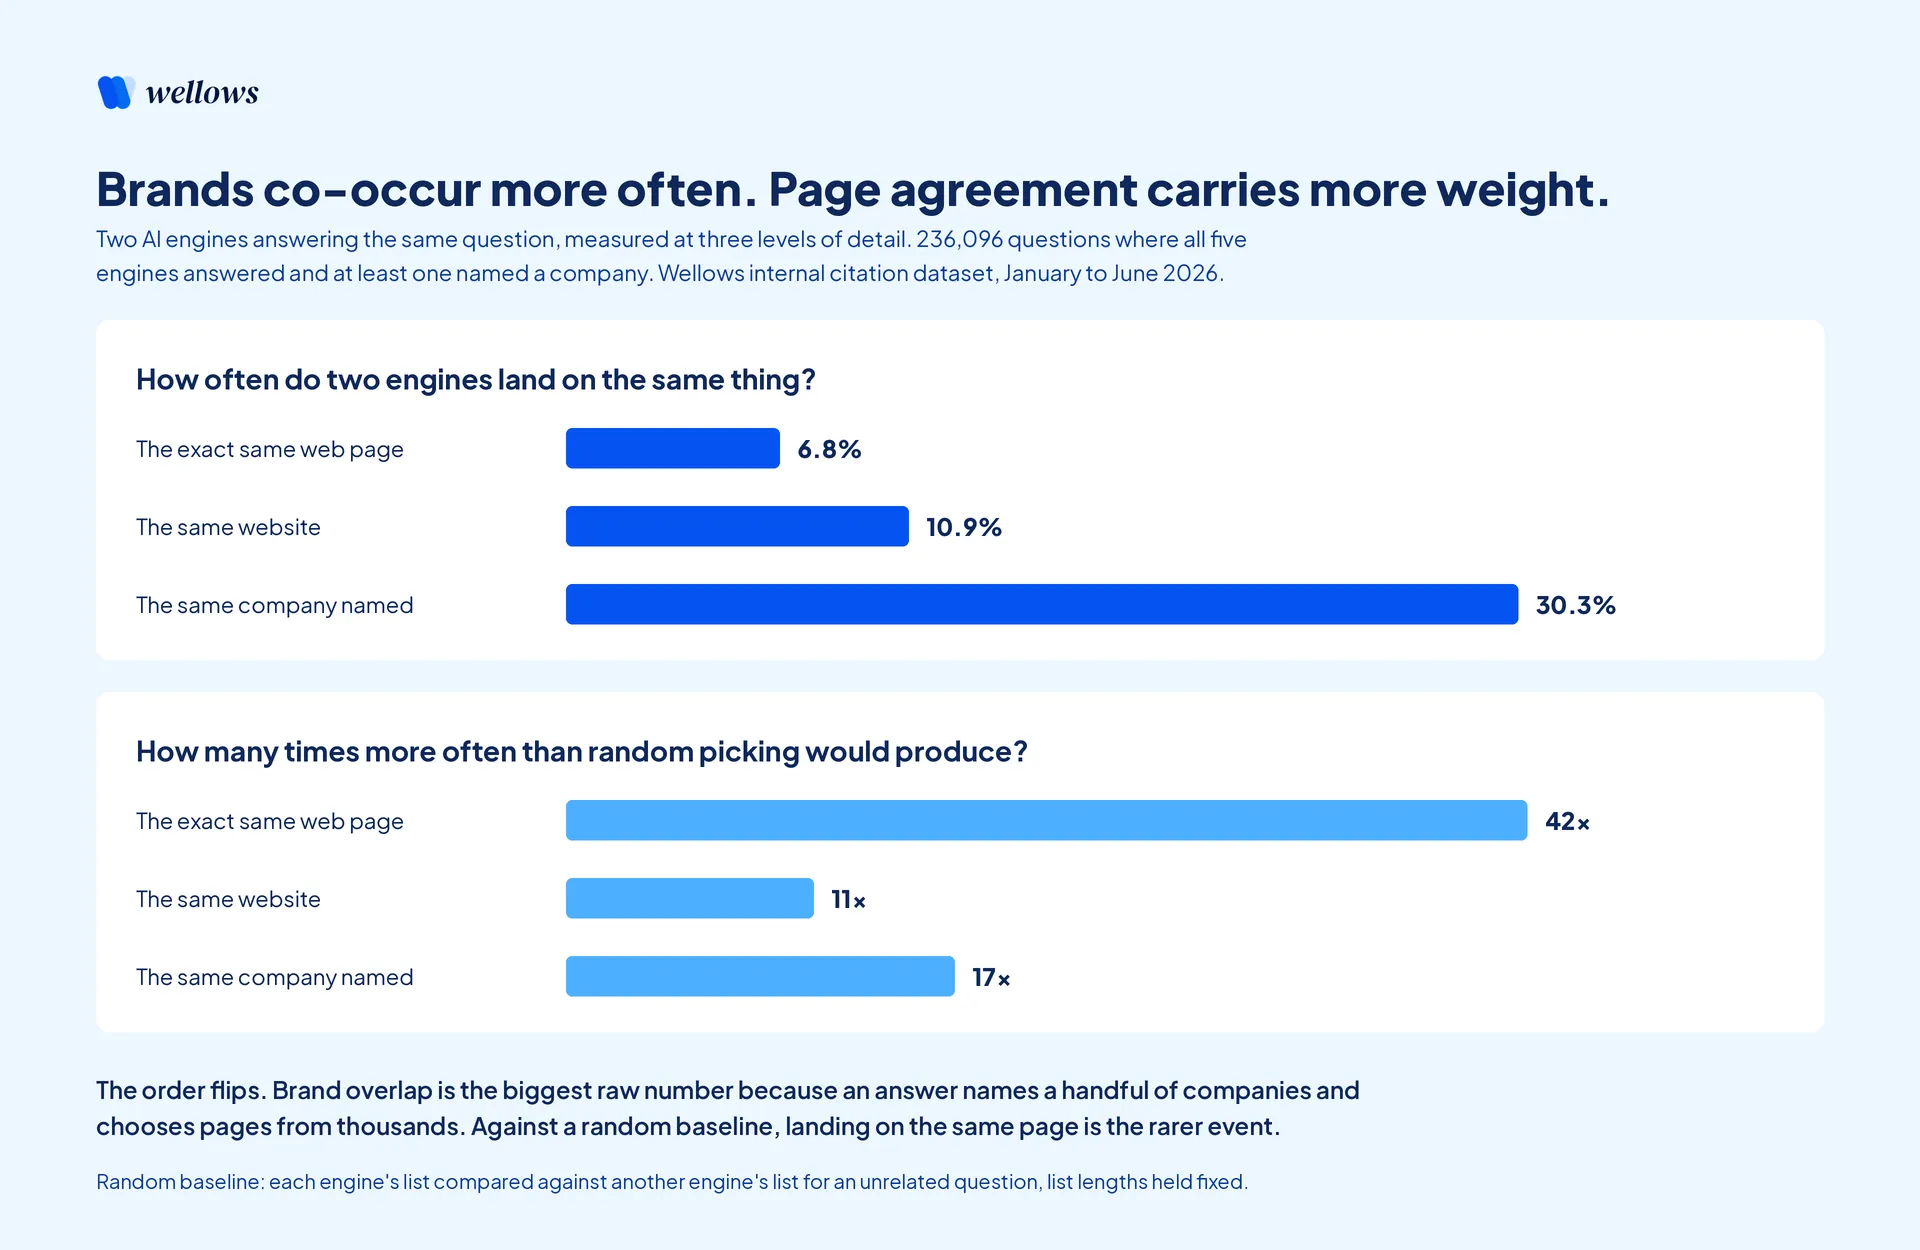
Brand overlap is the biggest raw number, but measured against random picking the order flips: two engines landing on the same page is the rarer and more meaningful event.
Read the top panel left to right. The engines share only 6.8% of exact pages, 10.9% of websites, and 30.3% of the brands they name. That’s roughly a 4.5x gap from most specific to most general, on the very same questions.
That comparison narrows to the 236,096 questions where all five engines answered and at least one of them named a brand. All three bars run on that same question set, but not on the same pair base.
The page and website figures use every engine pair on every one of those questions. The brand figure keeps only the pairs where both engines named at least one brand, so it sits on a narrower base, and the brand condition is a real filter in a way the page condition is not.
What the 4.5x does not mean
When we first published this, we flagged an obvious worry and said we had not yet tested it. An answer names a handful of brands and cites from a pool of thousands of possible pages.
Any overlap measure rises as the pool of plausible candidates shrinks, so some of the 4.5x might be arithmetic rather than behaviour. We have now tested it, and the worry was justified.
The test is a permutation. Take engine A’s list for one question and compare it against engine B’s list for a completely different, randomly chosen question, keeping every list the same length.
That tells you how much overlap you would see from two engines with no shared view of the topic at all. Then measure how far the real figures sit above it. That comparison is the lower panel of the chart above.
We ran it on three independent shuffles, and the results agreed to the third decimal, so nothing below hangs on a lucky draw.
| Level | Real agreement | Agreement if picking at random | How many times above chance |
|---|---|---|---|
| Exact page | 6.8% | 0.16% | 42x |
| Website | 10.9% | 1.0% | 11x |
| Brand | 30.3% | 1.8% | 17x |
The order inverts. In raw percentages brand agreement is the biggest number by a distance. Measured against chance, exact-page agreement is the strongest of the three and brand agreement sits well below it.
Brands are easy to co-occur on because there are so few candidates. Pages are hard, so when two engines land on the same one, something real is going on.
Both readings matter, and they answer different questions:
- If you want presence on more than one engine, brand is the easier target. 30.3% against 6.8% is a real difference in how often it happens, and that has not changed.
- If you want to know whether a result means anything, page agreement is the stronger signal. Two engines picking the same page is a 42x event. Two engines naming the same company is a 17x event.
What we would no longer say is that brand “travels 4.5x better” as though brand had some superior carrying property. It does not. It has a smaller field.
Brand is also the hardest of the three levels to define, and the choice moves the number a long way. We publish 30.3%, which counts only the pairs where both engines named at least one brand.
Score a question as a disagreement when one engine names a brand and the other names none, and the figure falls to 25.1%, which is a 3.7x gap over pages rather than 4.5x.
The page figure itself does not move under that convention, since the base already requires every engine to have cited at least one website, so no page list is ever empty. The gap over page agreement holds under every definition we tried.
The five engines also build citations differently, since some retrieve and link pages while one answers largely from what it already learned, and that mix could widen the brand-over-page gap on its own.
Here’s why all of this matters. “Are you visible in AI search?” was never one question. It’s two, and they have different answers:
- “Do the engines link to my exact pages?” A scattered, engine-by-engine problem. Rare, and meaningful when it happens.
- “Do the engines mention my company?” Much more common. Easier to achieve on several engines at once, and a weaker signal per occurrence.
Key finding: the two layers behave differently and need separate reporting. Brand co-occurrence (30.3%) runs about 4.5x page co-occurrence (6.8%), so brand is the easier route to appearing on more than one engine.
Against a random baseline it flips: page agreement is a 42x event and brand agreement a 17x one, so a shared page citation carries more information. Track both. Chasing only pages makes multi-engine presence look impossible, and chasing only brands makes weak results look like wins.
The reporting consequence is specific: page citations and brand mentions are two different measurements and they need two different lines.
Wellows separates them by design, counting both the times an engine links to you and the times it names you in the answer without a link, on each of the five engines. That second count is the layer that co-occurs most often, and it is invisible in any report that only tracks links.
If you want to know which side of the split you’re on, the ChatGPT and AI Overviews checks further down report both layers for your own website.
One competing reading belongs on the table, because it cuts against our own framing. Ahrefs compared Google’s two Search surfaces and found they cite the same web addresses only 13.7% of the time across 540,000 question pairs.
On a separate set of 730,000 response pairs, the two surfaces averaged 0.86 on a 0-to-1 semantic similarity scale, with 89% of pairs scoring above 0.8, so the answers usually meant much the same thing. That analysis covers September 2025 in the United States, which sits outside our window.
If the pattern generalises, engines can disagree about sources and still recommend the same companies. Citation visibility would then fragment harder than the outcome a buyer actually sees, which is a further reason to track the brand layer separately rather than folding it into a page report.
Why some engines agree: mostly the pool they draw from, not who built them
If agreement is so rare, what goes with it when it does happen? Our set includes two Google surfaces, AI Overviews and AI Mode, which gives us a useful within-company comparison.
Do engines built on the same underlying systems cite more alike than rivals do?
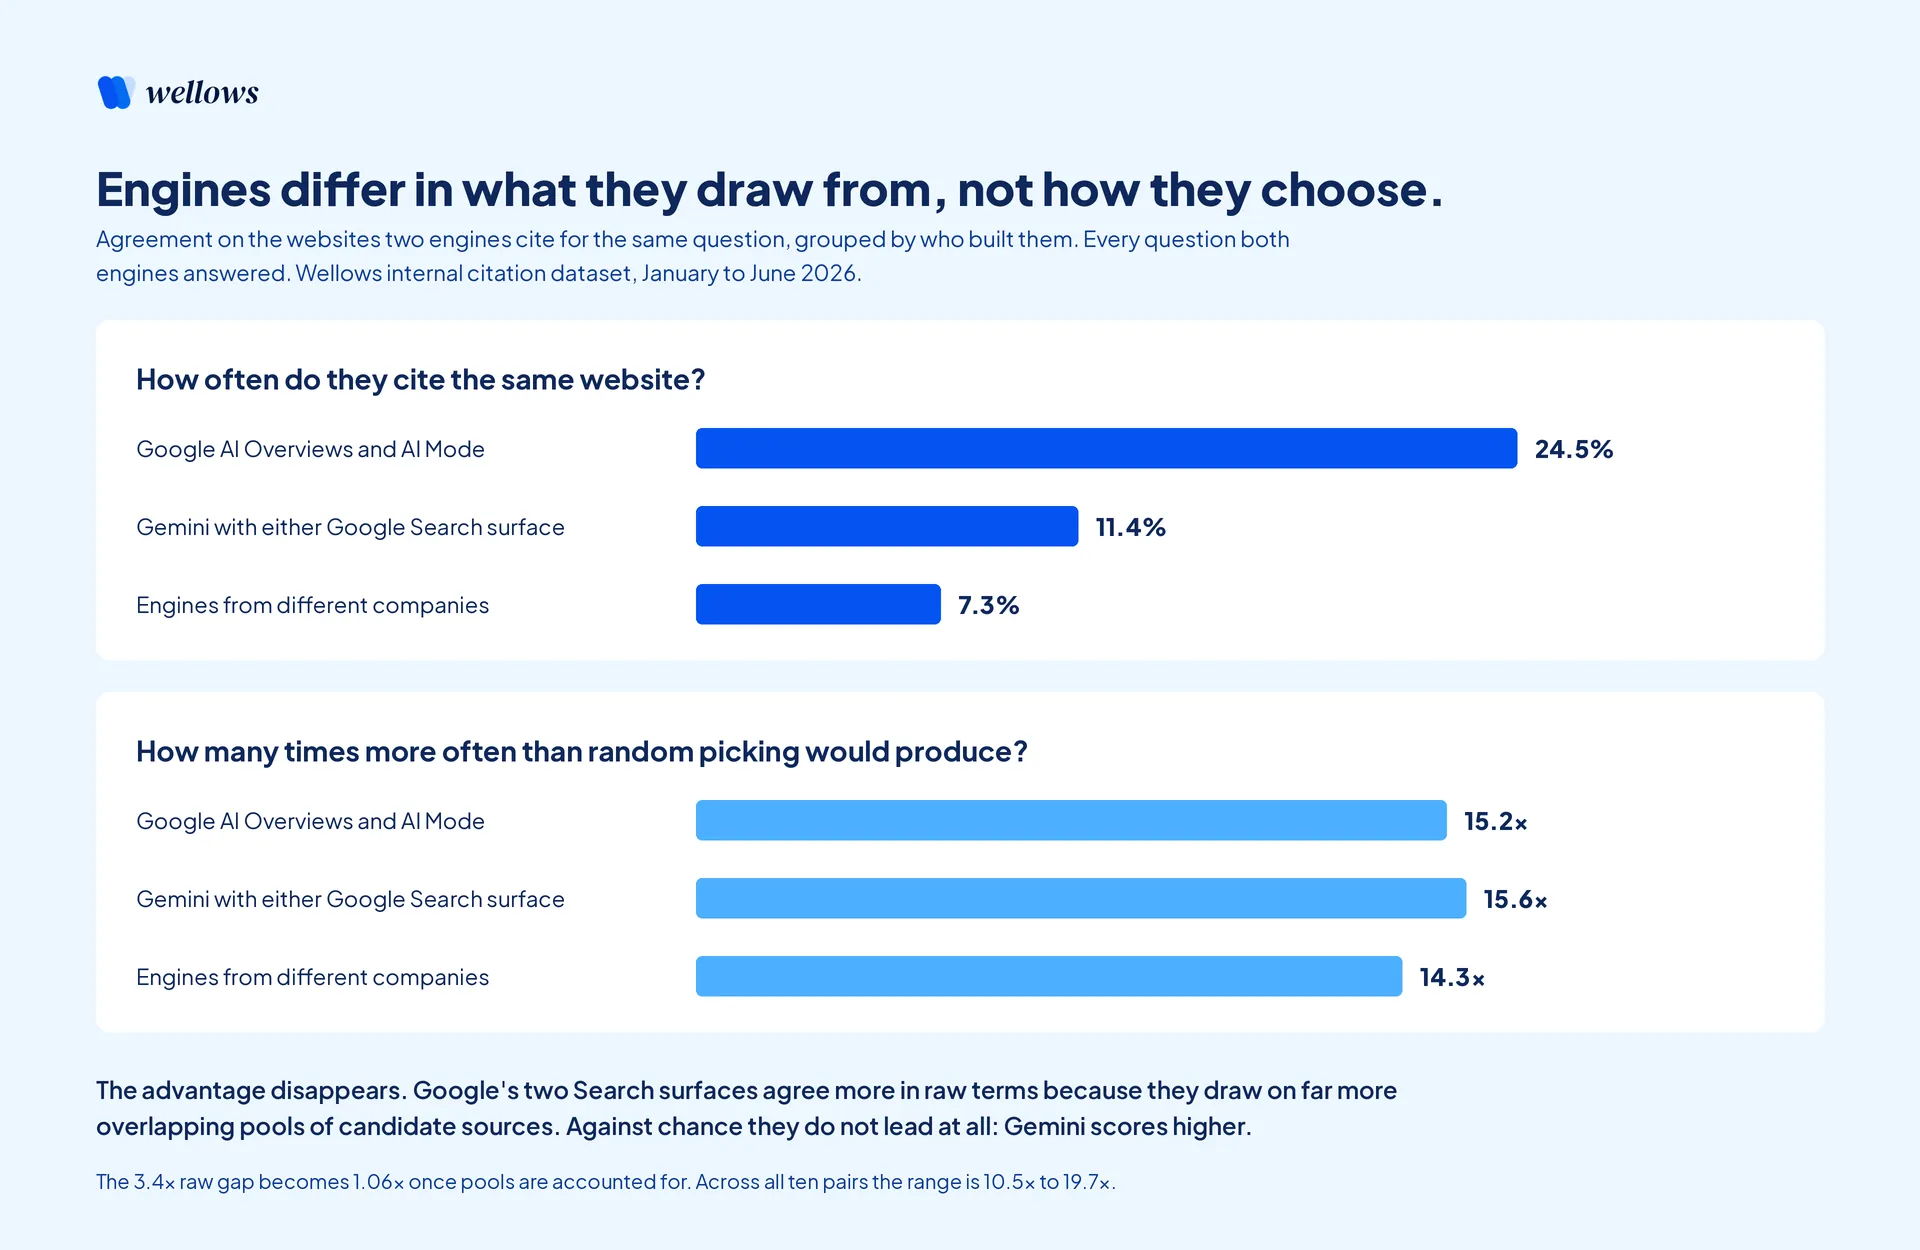
Google’s two Search surfaces agree far more in raw terms, yet relative to the pool each pair is choosing from, the advantage disappears.
In raw percentages, yes, and starkly. Measured on the websites they cite, the data splits into three tiers:
- Two Google engines. AI Overviews and AI Mode agree on 24.5% of websites.
- The wider Google family. Pair Gemini, one step further from core Search, with either Search surface, and the average drops to 11.4% of websites.
- Different companies entirely. Pairings across OpenAI, Google, and Perplexity average 7.3% of websites, with individual pairs running from 6.1% to 9.3%.
Google’s two Search surfaces agree 3.4x more often than cross-company pairs, and 2.1x more often than Gemini manages with either of them.
The tiers are averages, so they look cleaner than the underlying pairs: the best cross-company pair reaches 9.3%, close enough to Gemini’s 10.9% with AI Mode that the boundary between tier two and tier three is soft.
An honest complication before we interpret any of it. Other researchers put this same pair lower than we do. Ahrefs measured 13.7% of the same web addresses across 540,000 question pairs from September 2025, and SE Ranking reported 10.7% of addresses and 16% of websites.
Most of that gap is the level being matched rather than a disagreement about the world. Our 24.5% counts whole websites, so two engines citing different pages on the same site count as agreeing.
Match on the exact page instead, as both of those studies do, and the same pair comes out at 17.9% in our data, close to their range. Ours is still the highest of the three, on a commercially skewed question set from a later period, and anyone quoting 24.5% should know it is a website-level number.
Against a random baseline, the advantage disappears
We ran the same permutation test here that we ran on the brand ladder, and it does more damage to this section than it did to that one. The lower panel of the chart above shows the result.
Two Google surfaces do not just agree more with each other. They also draw on far more overlapping pools of candidate sources, so a shared citation between them is a much less surprising event than a shared citation between ChatGPT and Perplexity.
Divide each pair’s real agreement by what it would score picking at random, and the three tiers do not merely narrow. They stop being tiers at all:
| Pairing | Real agreement on websites | How many times above chance |
|---|---|---|
| AI Overviews and AI Mode | 24.5% | 15.2x |
| Gemini with either Search surface | 11.4% | 15.6x |
| Across different companies | 7.3% | 14.3x |
The 3.4x advantage becomes 1.06x, and the 2.1x reverses: measured against chance, Gemini paired with a Search surface scores higher than the two Search surfaces score with each other.
Whatever made AI Overviews and AI Mode look special in the raw numbers is almost entirely the fact that they are drawing from much the same pool.
Individual pairs vary more than the tier averages let on, and the variation does not follow ownership either. Across all ten pairings the figure runs from 10.5x to 19.7x, and the two highest are both cross-company: Gemini with Perplexity at 19.7x and ChatGPT with Perplexity at 19.1x.
So this is not a story about every pair behaving identically. It is a story about the ordering by owner vanishing once the pool is accounted for.
That is a narrower claim than we made when this went out, and a more useful one. Most of what separates two engines is which slice of the web they draw from, and the differences that remain do not follow who built them.
A near-two-fold spread still sits inside that 10.5x to 19.7x range, so engines do differ in how they choose from what they have. What ownership predicts is the pool, not the picking.
Gemini illustrates it from the other direction: it runs on the same Google index as AI Overviews and AI Mode yet reaches only 11.4% with either, so a shared index is not what lifts the two Search surfaces. Their candidate pools sit closer together than that.
The model layer moved inside our window too, which belongs on the list of reasons that pool might narrow. Google made Gemini 3 the default behind AI Overviews in January 2026, and at Google I/O on 19 May 2026 made Gemini 3.5 Flash the default model for AI Mode globally.
Our six-month average for that pair therefore spans a model change on each surface, and we have not yet split the figure either side of them. Google announced at that same May 2026 event that the two surfaces are merging into one AI Search experience, so the pair is converging by product decision as well.
Two further limits worth stating plainly. We can see the pattern, not the cause. And the high-agreement pair is a single observation, not a tested effect.
We did not measure content quality, page strength, or optimisation at all, so we cannot rank them against anything else. What we can say is narrower: the strongest pattern we could measure sits upstream of your page, in which sources an engine considers at all.
Page work can still lift your citation rate on any single engine, and nothing here tests that. What this says is that a win on one engine gives you little reason to expect a win on another, because the engines are not looking at the same candidate set in the first place.
Which is the practical case for measuring the five separately rather than inferring four from one.
Are the engines converging? Agreement rose 33% in six months
Everything so far is a snapshot. Six months of data can also show direction, and the direction is that this split is slowly closing.
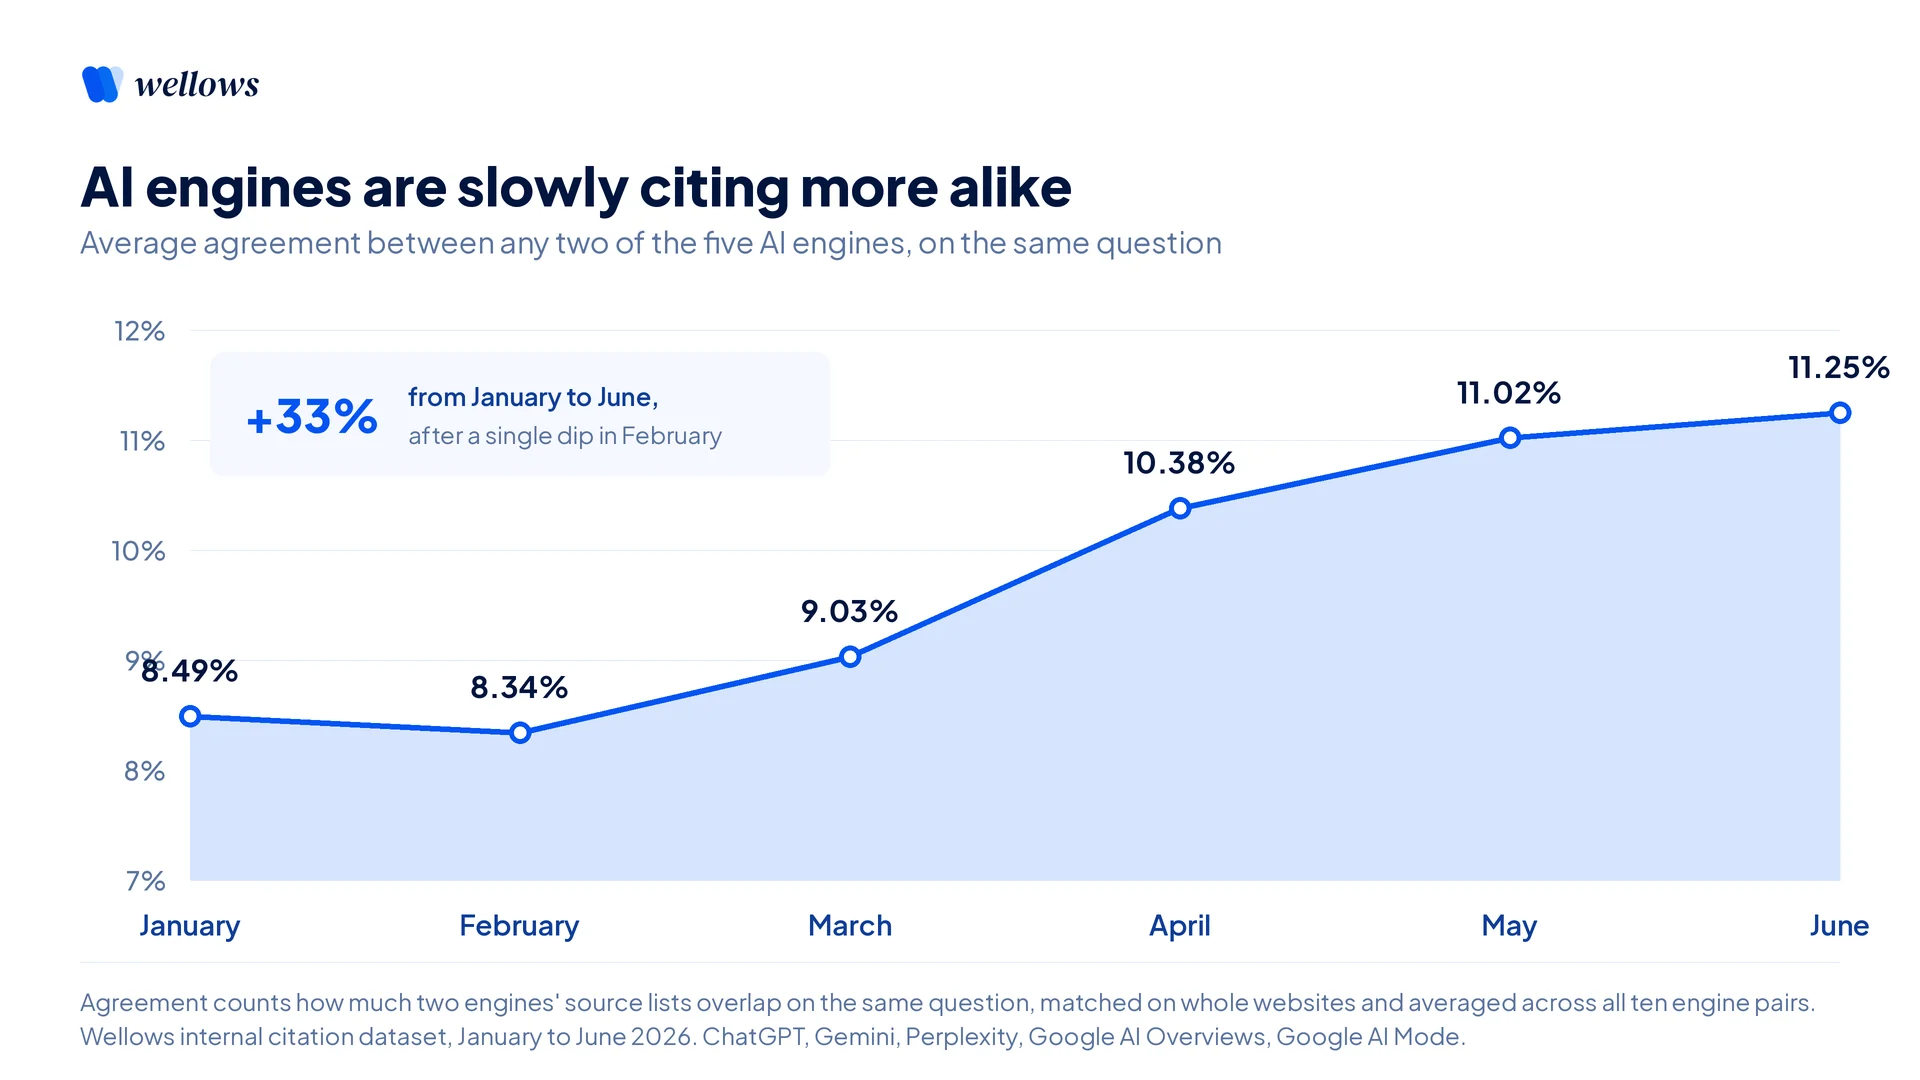
Average agreement between any two engines rose from 8.49% in January to 11.25% in June 2026, a 33% increase, with a single dip in February.
Take any two engines at random and measure how often they cite the same sources. That number climbed from 8.5% in January to 11.3% in June, dipping once in February and then rising every single month after. That’s a 33% rise in half a year, about 0.55 percentage points a month on average.
The path is not a straight line, though, and the shape matters. Almost all of the rise happens between February and May, which account for 2.67 of the 2.76 points gained across the whole window.
The month before and the month after barely move. A shift that concentrated looks more like a discrete change than gradual drift.
Six monthly points is a short run, so read the slope as a direction, not a forecast. Four other things could be moving it.
The set of questions Wellows tracks grew across the window. Google changed the models behind both its Search surfaces during it. Google announced in May 2026 that AI Overviews and AI Mode are merging, which lifts the highest-agreeing pair inside the average.
And we have not run the random baseline on this figure, so we cannot say how much of the rise is engines genuinely converging rather than candidate pools narrowing, which is the confound that took the weight out of two other findings in this study. We have not separated organic convergence from any of the four.
A second view of the same data points the same way. The share of sources cited by all five engines more than tripled over the same period, from 0.19% to 0.59%. Two readings of one overlap structure, both tilting the same direction.
One wrinkle in June is worth putting on the table, because it complicates both readings at once. In that month the share of sources only one engine cited also rose, from 77.7% in May to 78.5%.
So both ends of the distribution grew together, and what shrank was the middle: fewer sources reached two, three, or four engines. June is therefore not a clean convergence month.
It is a month in which a source became more likely to stand alone and more likely to be carried by everyone, and less likely to land anywhere between the two. Whether that is the start of a consensus list hardening around a small set of sources, or noise in a six-point series, we cannot tell from six months.
If this continues, AI engines will cite much more alike in 2027 than they do today. That cuts two ways. Sources everyone agrees on will pull ahead across all five at once, and today’s window, where a mid-sized site can own a niche one engine found and the others haven’t, is closing.
Engine-specific gaps look like a shrinking opportunity. Grab them while they’re here. Note what convergence does not do: it does not make per-engine tracking less useful. It raises the stakes of being on the consensus list, and watching all five is the only way to tell whether you are on it.
Your category matters more than the kind of question
Agreement isn’t spread evenly. So where does it pile up?
Most marketers would guess it depends on what the person is trying to do: research, shop around, buy. The data says that barely matters.
Research questions sit at 9.5% agreement, commercial questions at 9.7%, buying questions at 10.6%, and “find me this specific site” questions at 11.8%. That is a 2.3-point spread, or 24% in relative terms, and it is small next to what category does.
Sort by category instead and the spread is four times wider.
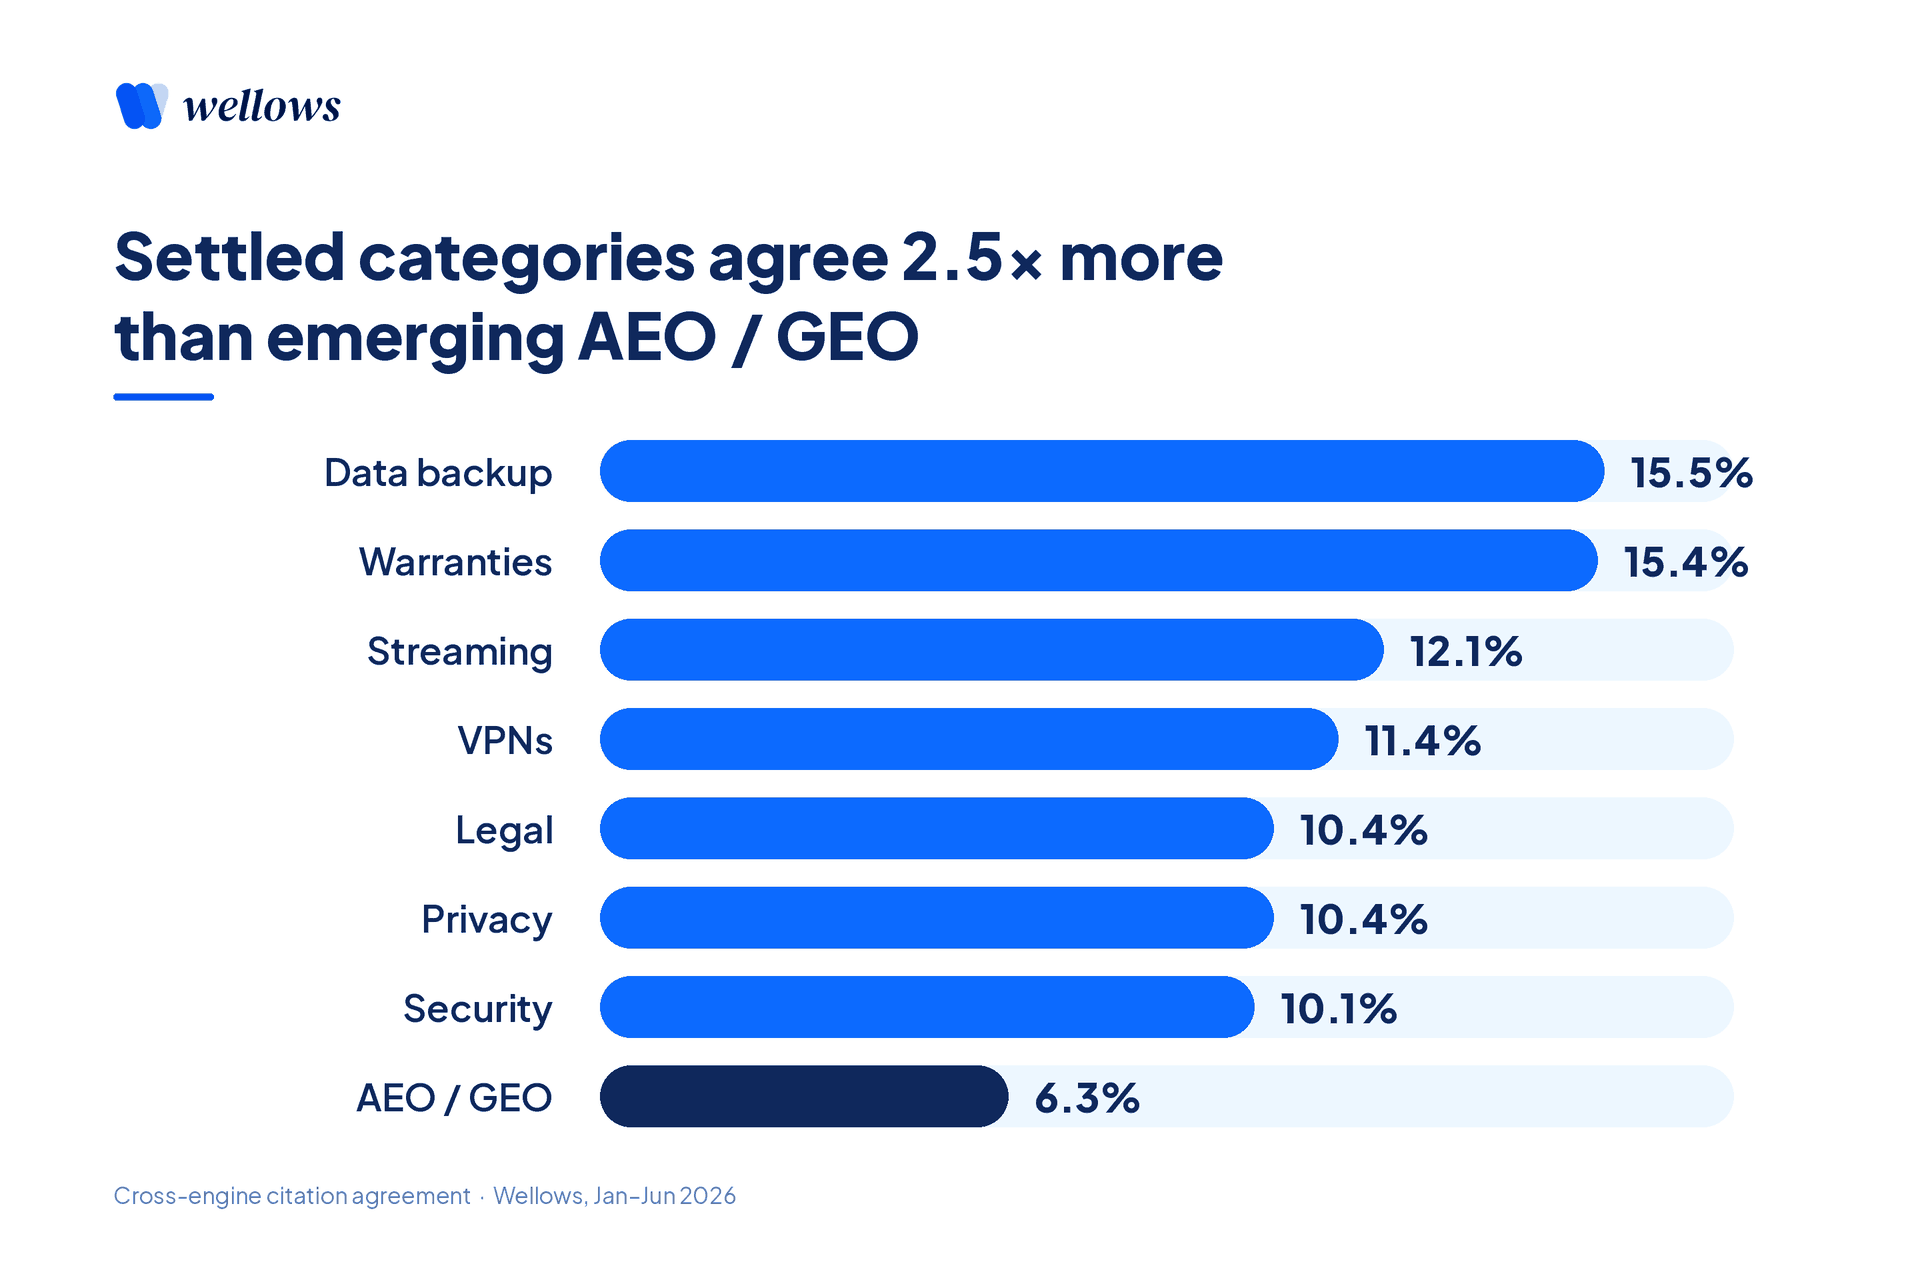
Settled commercial categories agree on 10.1% to 15.5% of cited websites. Emerging AEO/GEO sits at 6.3%, with every category pooled the same way for a like-for-like comparison.
To keep that comparison honest, we pooled every category the same way, adding together all the question topics that belong to it, so we’re never holding one narrow topic up against a broad group.
Settled commercial categories land between 10.1% and 15.5%, topped by data backup and recovery. These areas have a settled, trusted set of sources that every engine already leans on.
Now pool every question about AI visibility, AI SEO, LLM SEO, and generative engine optimisation into one emerging category. Call it AEO/GEO, short for answer engine optimisation and generative engine optimisation.
It sits at 6.3%, under two-thirds of the nearest settled category and about 40% of the highest one. There’s a huge pool of sources, no clear favourites yet, and the five engines each point to largely different writers.
That’s both the opportunity and the risk: easy to break in today, but a real chance today’s citation doesn’t survive as the category settles. Worth naming our own interest in that reading, since AEO/GEO is the category Wellows sells into, so “wide open” happens to suit us. The figure is 6.3% either way.
Three caveats. These categories come from the question set Wellows tracks for customers, not a survey of every industry.
We grouped them by hand, so we re-derived every grouping a second time with an automated topic match instead, and each category landed within 0.3 points of the figure above with the ordering unchanged. And we do not publish the question count behind each category, so trust the ordering more than any individual figure.
One thing this comparison cannot separate. Categories differ in the mix of questions they attract, so category and intent are tangled together rather than independent.
We report them side by side, not as two clean variables. We have also not run the random baseline by category, so read these as raw agreement rather than agreement above chance.
Category moves agreement by 9.2 points. The kind of question moves it by 2.3. To judge how crowded the citation game is for you, how settled your category is matters far more than what your customers are trying to do.
Reach and cross-engine carry-over are different things
Averages give you the shape of the field. A leaderboard shows you what actually travels.
So we built one. For every website, we counted how many of the five engines cited it on the same question. We withheld the names, since several are sites Wellows tracks for customers, but the categories and the numbers tell the story on their own.
| Website | Questions cited in (all five engines answered) | In all 5 engines | Avg engines / question |
|---|---|---|---|
| Product-protection warranty provider | 9,343 | 1,801 | 2.94 |
| Community discussion platform | 272,866 | 1,420 | 1.66 |
| Independent online bookstore | 2,990 | 576 | 3.26 |
| Website-builder platform | 12,265 | 544 | 1.52 |
| Online encyclopedia | 20,097 | 415 | 1.36 |
| Ticket-comparison marketplace | 1,528 | 395 | 2.92 |
About this table: the six websites all five engines cite together most often, January to June 2026, ranked by the “In all 5 engines” column. The second column counts only the 531,889 questions where every one of the five engines returned sources, so no site gains or loses credit for questions an engine skipped.
We withheld the names, and left out Wellows’ own site. This reflects the questions Wellows tracks for its customers, so it is not a ranking of the open web.
The column to watch is the last one, the average number of engines that cite a site whenever it appears at all. A score near 1.0 means it’s almost always cited alone.
Compare it against the second column and the two pull in opposite directions.
The most-cited site in our whole set, a community discussion platform, appears in 272,866 questions, by far the widest reach in the table.
Yet it averages just 1.66 engines. When one engine cites it, the others usually point to different threads on the same site.
The online encyclopedia is even more extreme at 1.36. Engines cite it constantly, and almost always alone.
The sites that genuinely travel are the narrow, trusted specialists: the bookstore at 3.26, the warranty provider at 2.94, the ticket marketplace at 2.92. Small reach, high carry-over.
Reach and cross-engine agreement are two different things, and in this table the biggest gathering sites are not the cross-engine magnets you’d assume.
Which is a third number worth reporting alongside the other two: not just whether you are cited, and not just where, but how many engines carry you on the same question.
Read the table as six examples rather than a rule, and note how we built it. We ranked by the all-five column, which is an absolute count and so favours high-volume sites, then drew a lesson about rates.
That selection can manufacture the pattern on its own, and it is the main reason to treat this as illustration rather than evidence. One row runs against the pattern anyway, since the website-builder platform is narrow and commercial and still carries over at only 1.52.
The last column is also held down by page fragmentation by construction, because a site with thousands of pages gives engines more ways to disagree, which is consistent with the two low scorers, though we did not measure it.
These six sites alone account for close to a fifth of every all-five pairing in the study, so consensus sits in very few places. We plan to test the pattern across all 280,245 websites rather than the top six.
Check your own citations, engine by engine
Every number above argues the same practical point. A blended score on its own can’t tell you where you stand on any single engine, because the engines aren’t looking at the same web.
The only way to know is to check each engine separately and compare. The ChatGPT and AI Overviews checks below are free, need no signup, and run 40 real buying-intent queries against your website. A third covers Perplexity.
| Check | What it returns | Run it |
|---|---|---|
| ChatGPT citation check The engine with the most unique pool (76.3%) |
Citation rate, direct citations, brand mentions, and where you appear in the answer | ChatGPT Visibility Tracker → |
| Google AI Overviews citation check The surface closest to your existing SEO work |
Whether your site appears as a direct link, or your brand is named as a source, inside real AI Overviews answers | AI Overviews Tracker → |
| Perplexity citation check The second most unique pool (69.9%) |
Which of your pages Perplexity cites, so you can set the result against your ChatGPT one | Perplexity Visibility Tracker → |
The free checks cover three of the five engines, one at a time. That is better than one blended number and it is not the whole board.
Wellows covers all five together, with page citations and brand mentions on separate lines and six months of history behind them, which is the setup the dataset in this study runs on.
The checks build their own question set for you. If you’d rather decide exactly which questions get tested, our LLM Query Builder turns your domain into 40 conversational queries, each tagged with the persona and the intent behind it.
The Query Fan-Out Generator then takes any single one of those and expands it into the semantically related variations engines tend to split a topic into.
How to read the results together. If one engine cites you and another doesn’t, that’s the normal state of this system, not an error to average away.
On exact pages the engines agree only 6.8% of the time. When they do, treat it as a real signal rather than a coincidence, since page agreement runs 42 times above what random picking would produce.
If none of them cites you but your brand is named in the answers, you have a page problem, not a brand problem, and the fix is different.
If your brand is missing everywhere, start with brand presence, since among questions where the engines name brands at all it is the layer that co-occurs most often. One bound on that: our 30.3% is measured only on pairs where both engines named a brand, so it says brand presence is the easier layer to hold across engines once you are in the conversation, not that it is the easier way to get into it.
What to do about it, by role
Back to that Monday dashboard. The number wasn’t useless. It was just closed, and it answered a question that has five separate answers underneath it.
The findings are the same for everyone. What changes is what you do on Monday morning. Find your row, then read the section below it.
| Your role | What this study changes for you | The number to hold onto |
|---|---|---|
| In-house SEO | Open the blended score into five engine lines, plus a separate brand line. | 6.8% pages vs 30.3% brands |
| Brand or marketing lead | Track page citations and brand mentions as two metrics, not one. | 42x vs 17x above chance |
| Agency | Scope by category maturity, and rebuild client reporting per engine. | 6.3% emerging vs 15.5% settled categories |
If you’re an SEO
A decade of rank tracking builds the instinct to want one number that says how you’re doing. Keep it. Just never let it be the only thing on the page.
- Report per engine, not blended alone. Pages overlap just 6.8% between engines, so a page winning on one and losing on another isn’t noise to average away. It’s the normal state of the system, and each gap needs its own diagnosis.
- Keep brand mentions on a separate line. They co-occur 30.3% of the time and behave like a different channel entirely. A report that only counts links cannot see this layer at all.
- Weight the two differently. A shared page citation is a 42x-above-chance event and a shared brand mention a 17x one. Brand tells you about reach across engines; pages tell you something is genuinely working.
- Watch carry-over, not just reach. Borrow the “average engines per question” column from the table above. A site can appear in 272,866 questions and still average 1.66 engines. That’s a carry-over problem, not a visibility problem.
If you’re a brand
The budget question this study speaks to is where cross-engine presence is achievable, though it stops short of pricing anything.
- Page wins land one engine at a time. Brand mentions show up on more of them. The engines name the same company about four and a half times more often than they cite the same page. That is a statement about how often it happens, not about brand work being more powerful.
You need both measurements: page data tells you which engine to work on, brand data tells you how wide your presence already is.
- Measure brand presence on its own line. If you’ve been treating mentions, reviews, and discussion as a nice-to-have next to content production, these numbers argue for tracking it as a first-class metric. What this study cannot tell you is what either activity costs to move, so treat this as a measurement change before you treat it as a budget one.
- Move before the shortlist hardens. Cross-engine agreement rose 33% in six months, and the pool of sources all five engines cite more than tripled. Companies that get on that list early are positioned to compound if consensus sets, though we have not tested how much of that rise is convergence rather than a narrowing candidate pool.
- Win your buyers’ engine first, then budget for ChatGPT separately. With this little overlap you can’t be everywhere at once. This study can’t tell you which engine your buyers use, but it can tell you ChatGPT draws on the most distinct pool of the five, so its citations are the ones you can least infer from what the other four are doing.
- Ask for per-engine breakdowns, not a single figure. A blended number can rise while the engine your buyers actually use goes dark. Wellows reports citations and brand mentions per engine across all five, so the headline number always opens into the five underneath it.
That timing asymmetry rewards younger challengers most, which is why we’ve set out a separate playbook for early-stage companies building AI visibility from zero.
If you’re an agency
This study hands you two things: a reporting structure, and a way to set client expectations before the work starts.
- Scope by category maturity. A settled category at 10 to 15% agreement is a slow, defensible displacement job. The emerging AEO/GEO space at 6.3% is a land grab: easier to enter, harder to hold. Same service, two very different roadmaps, and two very different prices.
- Never show the blended score alone. Keep the headline number if clients like it, then put five engine scoreboards and a brand-mention line beneath it. Build it so two of the five can collapse into one, since Google has said its two Search surfaces are merging.
- Pre-empt the hardest client question. “We won in AI Overviews, so why doesn’t ChatGPT mention us?” Those two engines cite the same sources just 6.9% of the time, while Google’s own two surfaces reach 24.5%, because those two draw on much the same pool of candidate sources and neither of you controls that pool.
Doing it across a full book of clients is its own operational problem, since every account now needs five scoreboards rather than one. Our AI visibility platform for agencies is built around that multi-client, per-engine structure.
We’ve set out what that reporting structure looks like in practice for agencies running AI visibility across a client roster.
None of this is a flaw in AI search. For publishers and challenger brands, it’s an unusually open playing field: three owners instead of one gatekeeper, with five surfaces heading towards four, and a brand layer that shows up across all of them more often than any single page does.
But it only works if you can see every board. Watching one scoreboard while playing five games is how brands end up confidently invisible.
The full method, and how we stress-tested it
In a new field, a bold claim is only as good as the method behind it. Here it is in full, laid out so you can poke holes in it.
How we measure agreement
For every question, each engine returns a list of sources it used. To see how much two engines agree, we count the sources they both used, then divide by the total number of different sources the two of them mentioned between them. Share nothing, that’s 0%. Identical lists, that’s 100%. We do this for every question and average the results. We measure at three levels: the exact web page, the website it sits on, and the brand named in the answer. A brand counts when the engine names the company in its answer text, whether or not it also links to that company, and we count named and implied mentions together. Measuring all three the same way, on the same questions, is what lets us compare them fairly. Separately, for the headline number, we counted how many of the five engines cited each individual source. Those are two different measurements, and we keep them apart throughout. One thing this measure does not do: it compares source lists question by question, and never tests whether a brand’s citation rate on one engine predicts its rate on another.
What each finding survived, and what it did not, is set out in the block at the top of this post, directly under the summary.
How the numbers narrow, step by step
- Six months of citations, January to June 2026: 22,749,707 citations across 1,146,483 questions and 441,946 websites.
- Keep only questions where all five engines cited at least one website: 531,889 questions, 13,037,251 citations, 280,245 websites.
- Reduce to distinct website-and-question pairings: 8,729,964. Several citations often point at different pages on one website, which is why pairings come out far below the citation count.
- Count how many engines cited each pairing. Exactly one engine: 6,949,766, which is the 79.6% headline. All five: 27,097, or 0.31%.
Every figure in this post traces back to one of those four steps, or to the narrower 236,096-question brand base described below. Where a section uses a narrower base, we say so.
Eleven things to know before you trust the numbers
- The questions lean commercial, and they are not one single market. They come from the brands Wellows tracks, all in English, spread across 27 markets: 84% of them in the United States, then Australia, the United Kingdom, the Philippines, and 23 others.
So this isn’t a random sample of everything people ask an AI engine anywhere, and it is not a US-only sample either. It is also a sample of brands that were already paying attention to AI visibility, which is a narrower group than commercial questions in general. The same applies to the categories: they are the topics Wellows tracks for customers, not a survey of every industry.
- All-five comparisons use only the 531,889 questions every engine answered, so no engine loses ground for skipping one. Pair-by-pair comparisons use every question both engines in that pair answered, which is a larger base, running from 590,087 to 942,983 questions depending on the pair.
The page-vs-website-vs-brand comparison narrows to the 236,096 questions where all five answered and at least one named a brand. Within that set the three bars do not share a pair base: page and website use every engine pair on every one of those questions, while brand keeps only the pairs where both engines named at least one brand.
That condition is a real filter, since it keeps only pairs where a brand mention happened on both sides, while the page bars carry no equivalent condition. That’s also why the same pair can report slightly different figures in different sections. We keep the base attached to every number rather than blending them, and the chance baselines are computed on the same base as the figure they sit beside.
- One website means one website. At website level we treat www.example.com and example.com as the same site rather than two. This matters for the counts above, and barely at all for the percentages: every engine-pair figure in this post moves by less than a tenth of a point either way.
- Group figures are averages of pairs. When we say cross-company agreement is 7.3% of websites, that’s the mean of the seven cross-company pairs, which individually run from 6.1% to 9.3%. The Google-family 11.4% is the mean of two pairs.
Averages make the tiers look cleaner than the pairs inside them, and that is true of the chance-adjusted figures too, where individual pairs run from 10.5x to 19.7x.
- Exact-page matching runs on tidied-up web addresses, stripping the protocol, www, tracking parameters, in-page anchors, default index files, and trailing slashes.
In-page anchors alone move page-level agreement by about three points, because two engines citing the same article via different section links would otherwise look like two different sources.
- This is real-world data, not a lab test. We can show how much the engines agree, but we can’t prove exactly why. Where we suggest a reason, we say so.
- We collected each question once per engine. AI engines do not return the same sources every time you ask, so part of what we measure as difference between two engines is each engine’s own run-to-run variation rather than a settled preference.
Ahrefs has reported that 45% of AI Overview citations change between generations, and that there is roughly a 70% chance of the content of an AI Overview changing between observations even while the meaning of the answer holds.
If a single engine agrees with itself on something like half its citations, that ceiling still sits far above the 6% to 25% we measure between engines, so repeat-run variance cannot account for the whole gap. It can account for some of it. We have not measured how much, and this remains the largest open question in the study.
- Engines return different numbers of sources per answer. Our measure divides shared sources by the combined list, so two engines with very different list lengths score lower even when the shorter list sits inside the longer one.
The five sit fairly close on this, averaging between 3.8 and 4.7 distinct websites per answer: Perplexity 4.7, AI Overviews 4.5, ChatGPT 4.2, AI Mode 4.0, Gemini 3.8. We still report agreement without correcting for list length, and we have not yet run a measure that ignores it, so some of what we count as disagreement is one engine simply returning more sources than the other.
- Our measure is sensitive to how many candidates exist, and we correct for it where we have run the test. An answer names a handful of brands and cites from thousands of possible pages, and any overlap measure rises as that pool shrinks.
We tested it with a permutation, comparing each engine’s list against another engine’s list for a random unrelated question while holding list lengths fixed, repeated across three independent shuffles that agreed to the third decimal. Random picking scores 0.16% at page level, 1.0% at website level, and 1.8% at brand level, so the real figures sit 42x, 11x, and 17x above chance.
That reverses the raw ordering, and both readings appear in the brand section above. The same test flattens the gap between Google’s two Search surfaces and everyone else.
One property of that test worth stating: the unrelated question is drawn from anywhere in the set, so any shared topical grounding between two engines registers as signal. A stricter version, drawing the comparison question from the same category, would separate shared topic from shared pool and would put the multiples lower. We have not run it.
We also ran this only on the pairwise agreement figures. We have not run it on the convergence trend, on the category figures, or on the engine-count measures behind the 79.6% headline and the per-engine uniqueness shares, so none of those is corrected for pool size.
- Five engines, not all of them. These are the five Wellows tracks. Claude, Copilot, Grok, and others are absent, so every count of surfaces here describes our set rather than the whole market.
- We measured overlap, not correlation. Everything here compares which sources two engines cite on the same question. Nothing here tests whether a brand’s citation rate on one engine predicts its rate on another.
A blended score could still track direction usefully at these overlap levels, which is why we argue for opening it into five engine lines rather than claiming it carries no information at all.
The headline holds under stricter matching
Here’s a fair challenge to a number like 79.6%: maybe we picked the settings that flatter it.
The opposite is true, and it’s worth being precise about why. Both choices behind the headline make the engines look more alike, not less:
- Website-level matching is looser than page-level matching. Two engines citing different articles on the same site count as agreeing. That finds more agreement, so fewer sources come out unique to a single engine.
- Tidying up web addresses does the same thing. Stripping tracking parameters and in-page anchors makes addresses match that would otherwise have counted as two separate sources.
So 79.6% is the floor on that dimension, not the ceiling. Tighten either setting and the number climbs.
Here are the same five engines, on the same questions, with only the match getting stricter at each step:
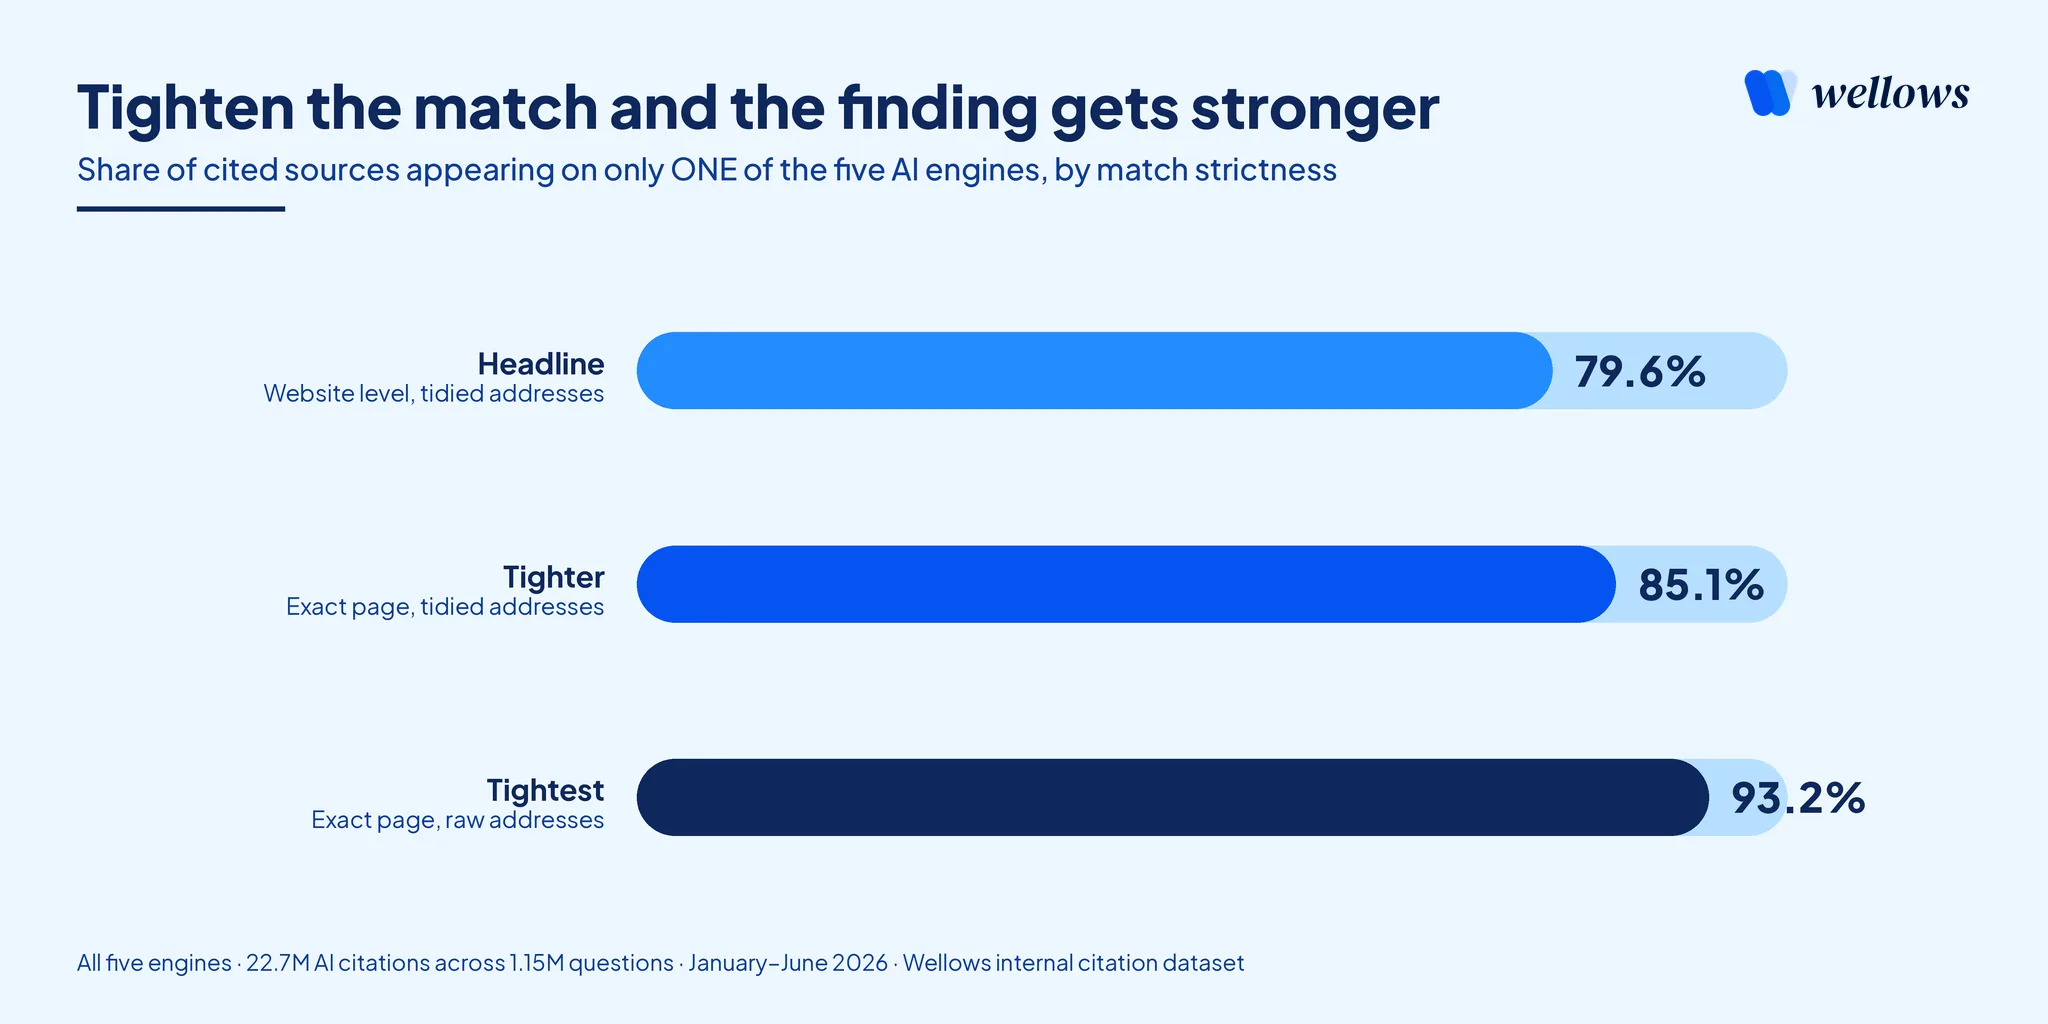
Tighten the match and the finding gets stronger, never weaker, rising from 79.6% at the loosest setting to 93.2% at the strictest, across all five engines.
| Test conditions | Engines | Matched at | Share cited by one engine only |
|---|---|---|---|
| Headline (loosest match) | 5 | Website, tidied addresses | 79.6% |
| Tighter | 5 | Exact page, tidied addresses | 85.1% |
| Tightest | 5 | Exact page, raw addresses | 93.2% |
Every version of this test lands higher than the headline. The finding doesn’t weaken under tougher matching, it strengthens.
We lead with 79.6% because it is the most conservative number this test produces: the loosest matching, on the full five-engine set. Every stricter cut lands above it.
One boundary on that claim, and it is a real one. This tests match strictness and nothing else. It does not test run-to-run variation, drift in the tracked question set, whether per-engine scores move together, or how the headline would look against a random baseline, since we ran that test on the pairwise figures rather than on this one.
Those sit in the caveats above. Conservative on matching is not the same as conservative overall, and we would not describe the headline as stress-tested in general. Where we have run an adversarial test, on the candidate-pool question, part of a published finding did not survive it, and we have said so rather than quietly dropping it.
Frequently asked questions
For each question we counted the sources any two engines shared and divided by the total number of different sources across both, then averaged over all questions. Separately, for the headline number, we counted how many of the five engines cited each individual source.
The study covers 1 January to 30 June 2026: 22,749,707 citations across 1,146,483 questions, from Wellows’ internal citation dataset. All five engines cited on 531,889 of those, which produce the 8,729,964 website-and-question pairings behind the headline.
The full method sits above, with the matching rules, the base at every level, and all eleven caveats.
Google AI Overviews and Google AI Mode lead at 24.5%, then Gemini with AI Overviews (12.0%) and Gemini with AI Mode (10.9%).
Cross-company pairs follow: AI Overviews and Perplexity (9.3%), AI Mode and Perplexity (8.3%), Gemini and Perplexity (7.4%), AI Overviews and ChatGPT (6.9%), AI Mode and ChatGPT (6.5%), ChatGPT and Perplexity (6.5%), and Gemini and ChatGPT last at 6.1%.
That ordering does not survive a random baseline. Adjusted for how much each pair’s candidate pools overlap, the ten pairs run from 10.5x to 19.7x above chance with no pattern by owner, and the two highest are both cross-company.
Yes, and we have now measured the reverse as well. Of every website ChatGPT cited, Perplexity never cited 89.1% on the same question. Turn the comparison around and ChatGPT never cites 90.1% of Perplexity’s.
The same holds against the other three. ChatGPT misses 89.7% of AI Overviews’ websites, 89.6% of AI Mode’s, and 90.5% of Gemini’s, against 89.2%, 90.2%, and 91.5% in the published direction.
So the gap is not an artefact of which engine you divide by. The two directions sit within 1.4 points of each other in every pair, and which one is larger simply tracks how many sources each engine returns per answer, from 3.8 websites for Gemini to 4.7 for Perplexity.
One qualification on what the gap means: against a random baseline ChatGPT’s four pairings run from 11.2x to 19.1x above chance, inside the 10.5x to 19.7x range covering all ten pairs. The gap reflects the slice of the web ChatGPT draws from, not a more unpredictable way of choosing within it.
It comes from 6,949,766 of the 8,729,964 website-and-question pairings across the 531,889 questions all five engines answered, and it held between 77.7% and 81.0% in every one of the six months.
It is also the most conservative version on the dimension we tested. Website-level matching on tidied addresses is the loosest setting we have. Tighten to the exact web page and it rises to 85.1%, or 93.2% with no address cleanup at all.
What it does not account for: run-to-run variation, since we collected each question once per engine, and whether the five engines’ per-brand scores move together, which we never measured. It has also never been measured against a random baseline.
Mostly because there are far fewer brands to choose from. The engines land on the same exact page 6.8% of the time and name the same company 30.3% of the time, measured on the 236,096 questions where all five answered and at least one named a brand.
Those three levels share a question set but not a pair base. Page and website use every engine pair on every one of those questions, while brand keeps only the pairs where both engines named at least one brand.
We tested the candidate-pool worry with a permutation, comparing each engine’s list against another engine’s list for a random unrelated question while holding list lengths fixed, across three independent shuffles. Random picking scores 0.16% at page level and 1.8% at brand level, which puts real page agreement 42x above chance and brand agreement 17x.
So brand is the easier route to appearing on more than one engine, while a shared page citation is the stronger signal that something is working. Definition moves the brand number a long way too: 30.3% counts only pairs where both engines named a brand, and scoring a one-sided naming as a disagreement drops it to 25.1%.
Their candidate pools, not their judgement. AI Overviews and AI Mode agree on 24.5% of the websites they cite, against an average of 7.3% for engines from different companies.
Against a random baseline that advantage disappears. The Google pair sits 15.2x above chance, cross-company pairs 14.3x, and Gemini with either Search surface 15.6x, which is higher than the two Search surfaces manage with each other. The premium is about 1.06x rather than 3.4x.
Gemini shows the same thing from the other side: it runs on the same Google index yet reaches only 11.4% with either Search surface. Google also changed the model behind AI Mode inside our window and announced in May 2026 that the two surfaces are merging.
Other researchers put this pair lower than we do, with Ahrefs at 13.7% of web addresses and SE Ranking at 10.7%. Much of that gap is the matching level: our 24.5% counts whole websites, and matched on the exact page the same pair comes out at 17.9% in our data.
On this evidence yes, though it is the finding we have tested least. Monthly average agreement rose from 8.49% in January to 11.25% in June, a 33% rise, about 0.55 percentage points a month.
Almost all of it lands between February and May, which account for 2.67 of the 2.76 points gained. Six monthly points is a short series, so read it as a direction rather than a forecast.
Four things could produce the same shift: the tracked question set grew, Google changed the models behind both its Search surfaces, Google announced a merge of those two surfaces in May 2026, and we have not run the random baseline here, so narrowing candidate pools are not ruled out.
June complicates it. The share cited by only one engine also rose that month, from 77.7% to 78.5%, so both ends of the distribution grew and the middle shrank.
Barely. Research questions sit at 9.5% agreement, commercial at 9.7%, buying at 10.6%, and navigational at 11.8%, a 2.3-point spread.
Category matters about four times more, running from 6.3% for emerging AEO/GEO topics to 15.5% for the most settled category in our set. We pooled every category the same way so the comparison is like-for-like.
Two limits: category and intent are not independent, since categories differ in the question mix they attract, and we have not run the random baseline by category. Trust the ordering more than any single figure.
Start where your buyers ask questions, and build brand presence everywhere, since among questions where engines name brands at all that is the layer that co-occurs most often. Then expand engine by engine at the page level.
We did not measure page quality or optimisation at all, so we cannot say architecture beats page factors. What we can say is that the five work from different candidate pools, so there is no reason to assume one generic effort aimed at all of them lands on all of them.
Report the five separately and you can see which one your effort actually moved.
Note on earlier work: others have observed the split of AI citations across engines before, including Kevin Indig in “The Consensus Gap” (Growth Memo, May 2026), which reported 91% of citations appearing on one engine only, across three engines. That sits above our 79.6% for a reason worth stating: fewer engines give a source fewer chances to overlap, and our headline matches at website level rather than page level. Our comparable page-level figure across five engines is 85.1%. We ran this study independently, on Wellows’ own five-engine dataset.


![AI Visibility for B2B Marketing Agencies: The Shortlist-Defense Playbook [2026]](https://staging.wellows.com/wp-content/uploads/2026/06/ai-visibility-b2b-marketing-agencies.webp)